![[Tool Share] We Open-Sourced a DeepSeek API Usage Dashboard — Pure Frontend, Zero Upload, Drag-and-Drop](/_next/image?url=%2Fblog%2Fbru-no-cassettes-5148602_640.jpg&w=3840&q=75)
[Tool Share] We Open-Sourced a DeepSeek API Usage Dashboard — Pure Frontend, Zero Upload, Drag-and-Drop
Over the past few months, our team has been using the DeepSeek API extensively across several projects — from AI-assisted coding to automated workflows. Call volume kept climbing.
Then the bills arrived.
The Problem: When CSV Becomes a Reading Comprehension Test
DeepSeek's official dashboard provides monthly CSV exports, which is great. But when you actually open that file and stare at hundreds of rows of numbers, only one question remains:
"So... which project is burning the most tokens?"
We're not joking. The CSV has fields like utc_date, model, api_key_name, type, amount — comprehensive data, but completely unsuitable for human reading. Want to answer these questions? Get ready for manual pivot tables in Excel:
- What's our total cost this month? What's the daily trend?
- Which API Key is consuming the most? What's the cost breakdown?
- Is our cache hit rate where it should be? Room for optimization?
- How does usage compare across different models?
Every question requires significant manual work — and you have to repeat it every month.
The Solution: Build a Dashboard Ourselves
As a team whose motto could be "if code can solve it, don't do it by hand," we decided to build a visualization tool ourselves.
Three core principles:
- Absolute security — Billing data contains sensitive cost information and must never be uploaded to any server
- Dead simple UX — Drag and drop CSV files, get instant charts, zero configuration
- Open source — Code is public so anyone can audit and contribute
Based on these principles, we chose a pure frontend architecture: Next.js 16 (App Router) + React 19 + TypeScript for the framework layer, Papa Parse for CSV parsing in a browser Worker thread, and ECharts 5 for chart rendering. All computation and rendering happens 100% in your browser — no backend servers, no databases, no data ever leaves your device.
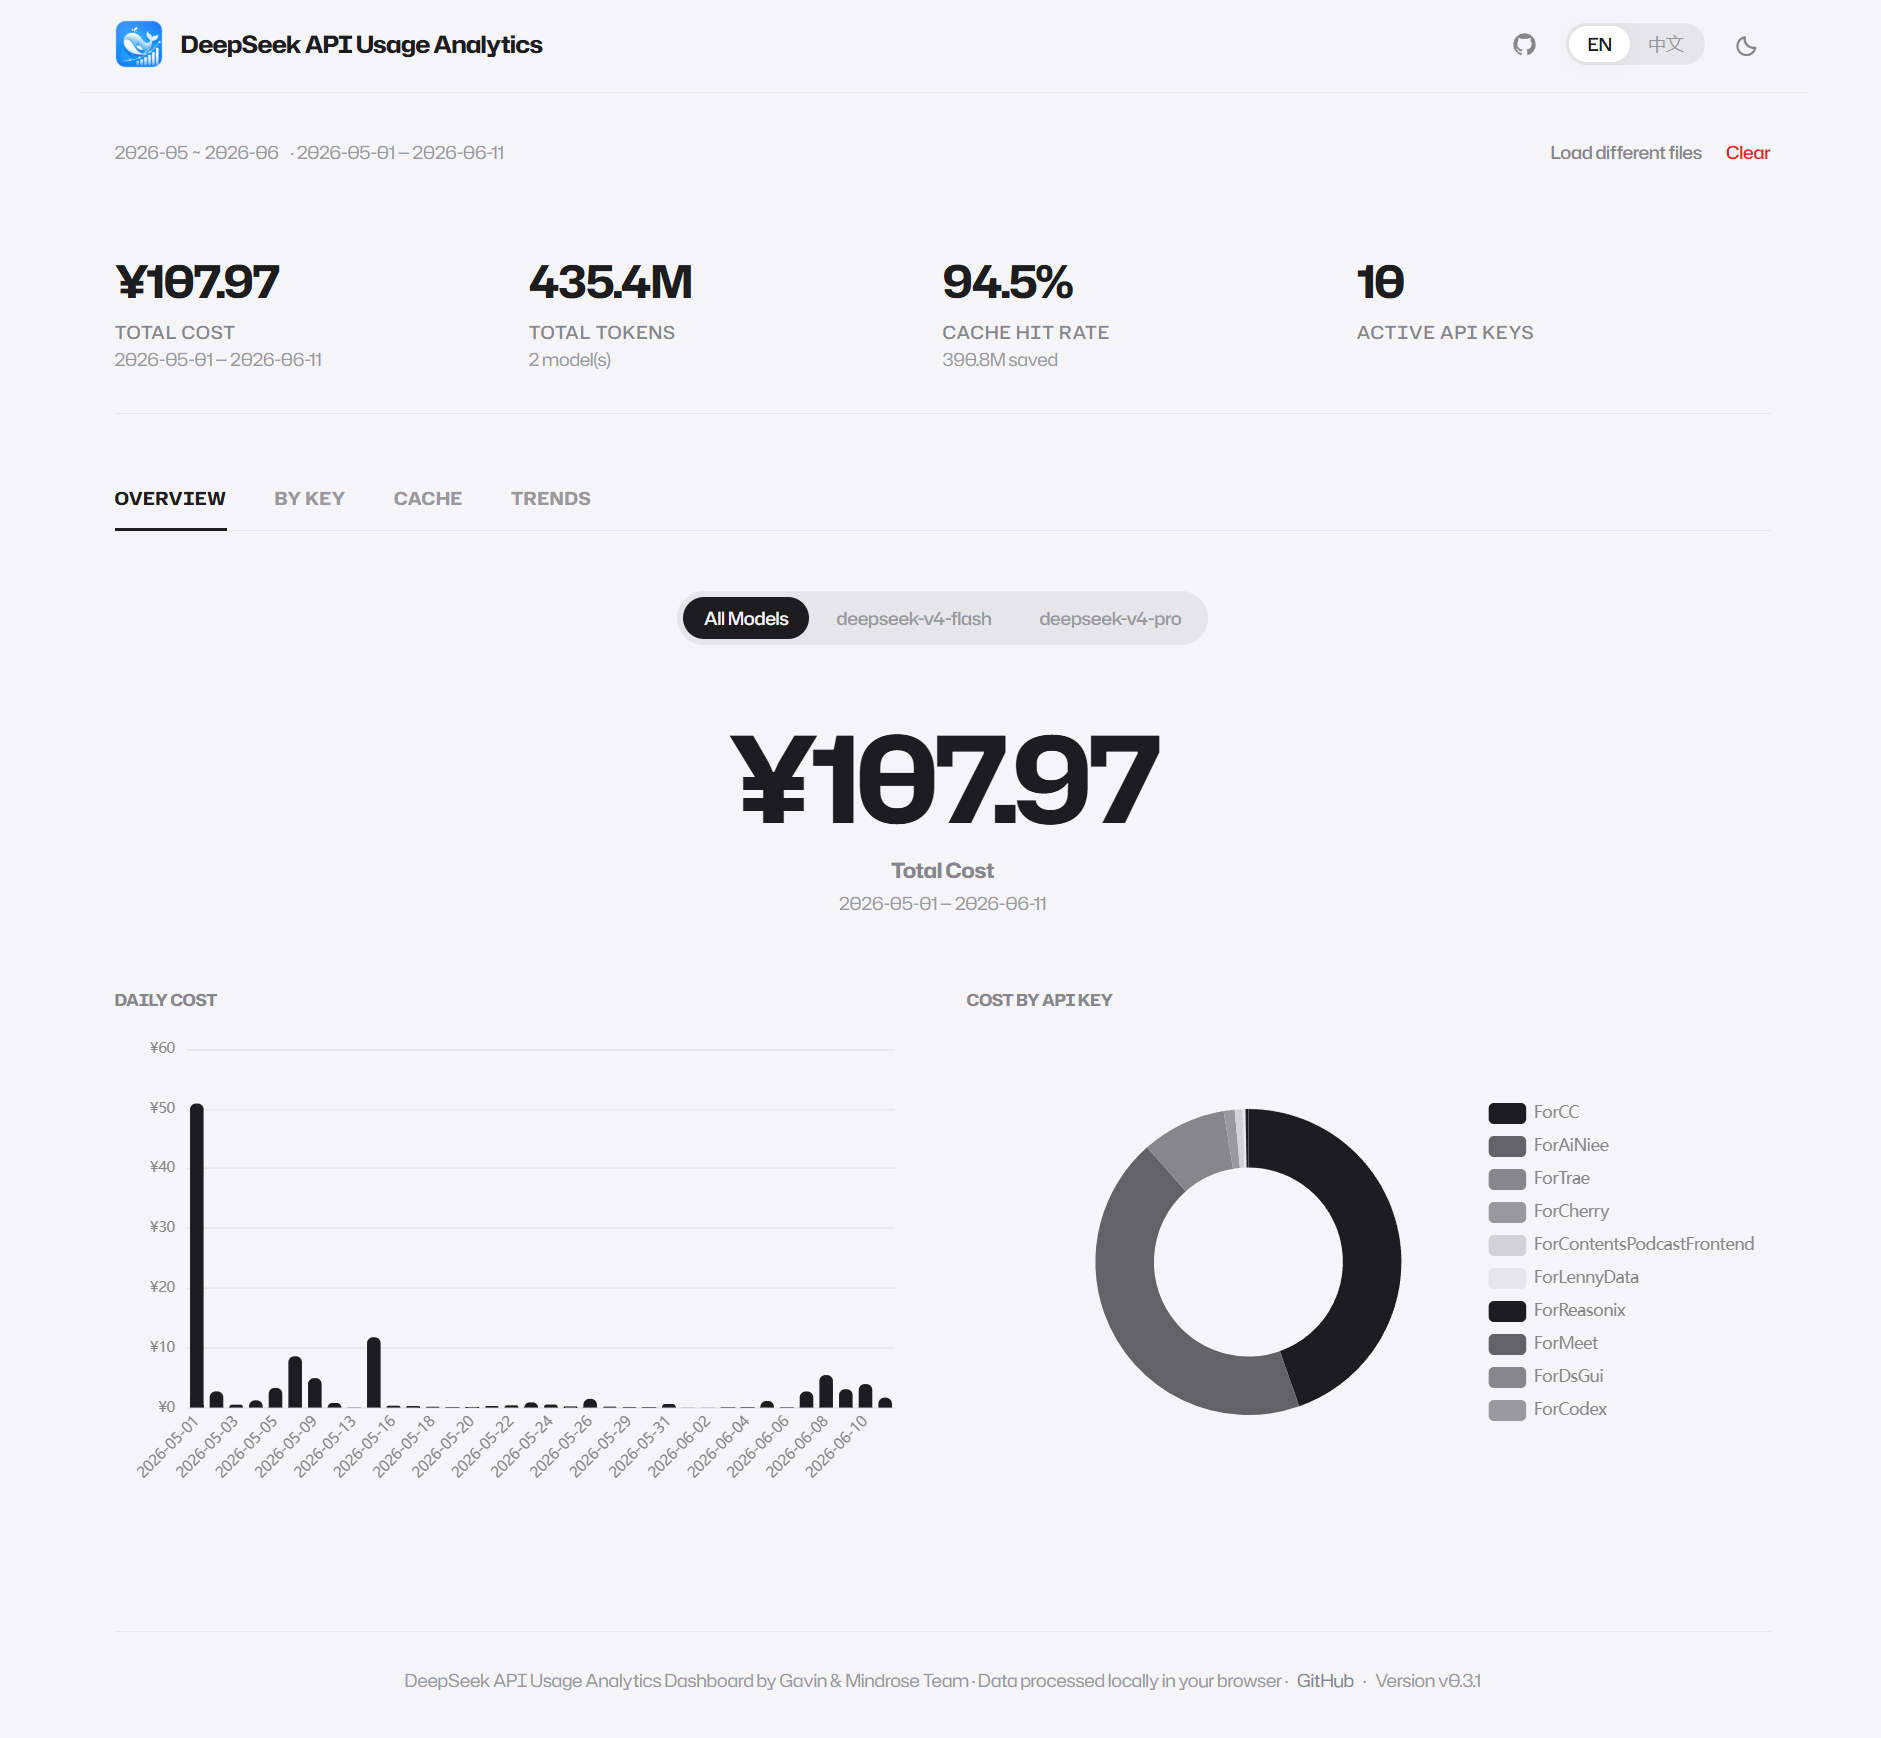
Feature Overview
Four Analysis Dimensions
| Dimension | Chart Types | What You See |
|---|---|---|
| Cost Analysis | Bar chart + Donut chart | Daily cost trends, per-key cost distribution |
| Usage Analysis | Full-width table | Per-key tokens, cost, request count, cost ratio bars |
| Cache Analysis | Line chart + Stacked bar chart | Daily cache hit rate trends, per-key hit/miss comparison |
| Trend Analysis | Switchable line chart | Freely switch between cost/tokens/hit rate/requests |
Practical Highlights
- Smart Multi-Month Merging — Drop files from multiple months at once, automatic filename-based pairing and merging
- Model Filter — Apple-style segmented control for switching between models
- Bilingual UI — Chinese/English toggle with persistent dark/light theme
- KPI Cards — Four-column big-number display: total cost, total tokens, cache hit rate, active keys
Architecture: Why Pure Frontend
When handling billing data, privacy is a non-negotiable baseline. We chose a pure frontend architecture not because we lack backend capabilities, but because:
Your billing data should exist only in your own browser memory, from start to finish.
Implementation details:
- CSV Parsing — Papa Parse runs asynchronously in a Web Worker, non-blocking UI
- Chart Rendering — ECharts 5 provides rich interactive charts
- Theme System — CSS custom-property-driven dual themes (dark/light), Apple-inspired minimalist design
- Deployment — Vercel, static site, global CDN
The code is fully open source on GitHub — audit, star, and contribute.
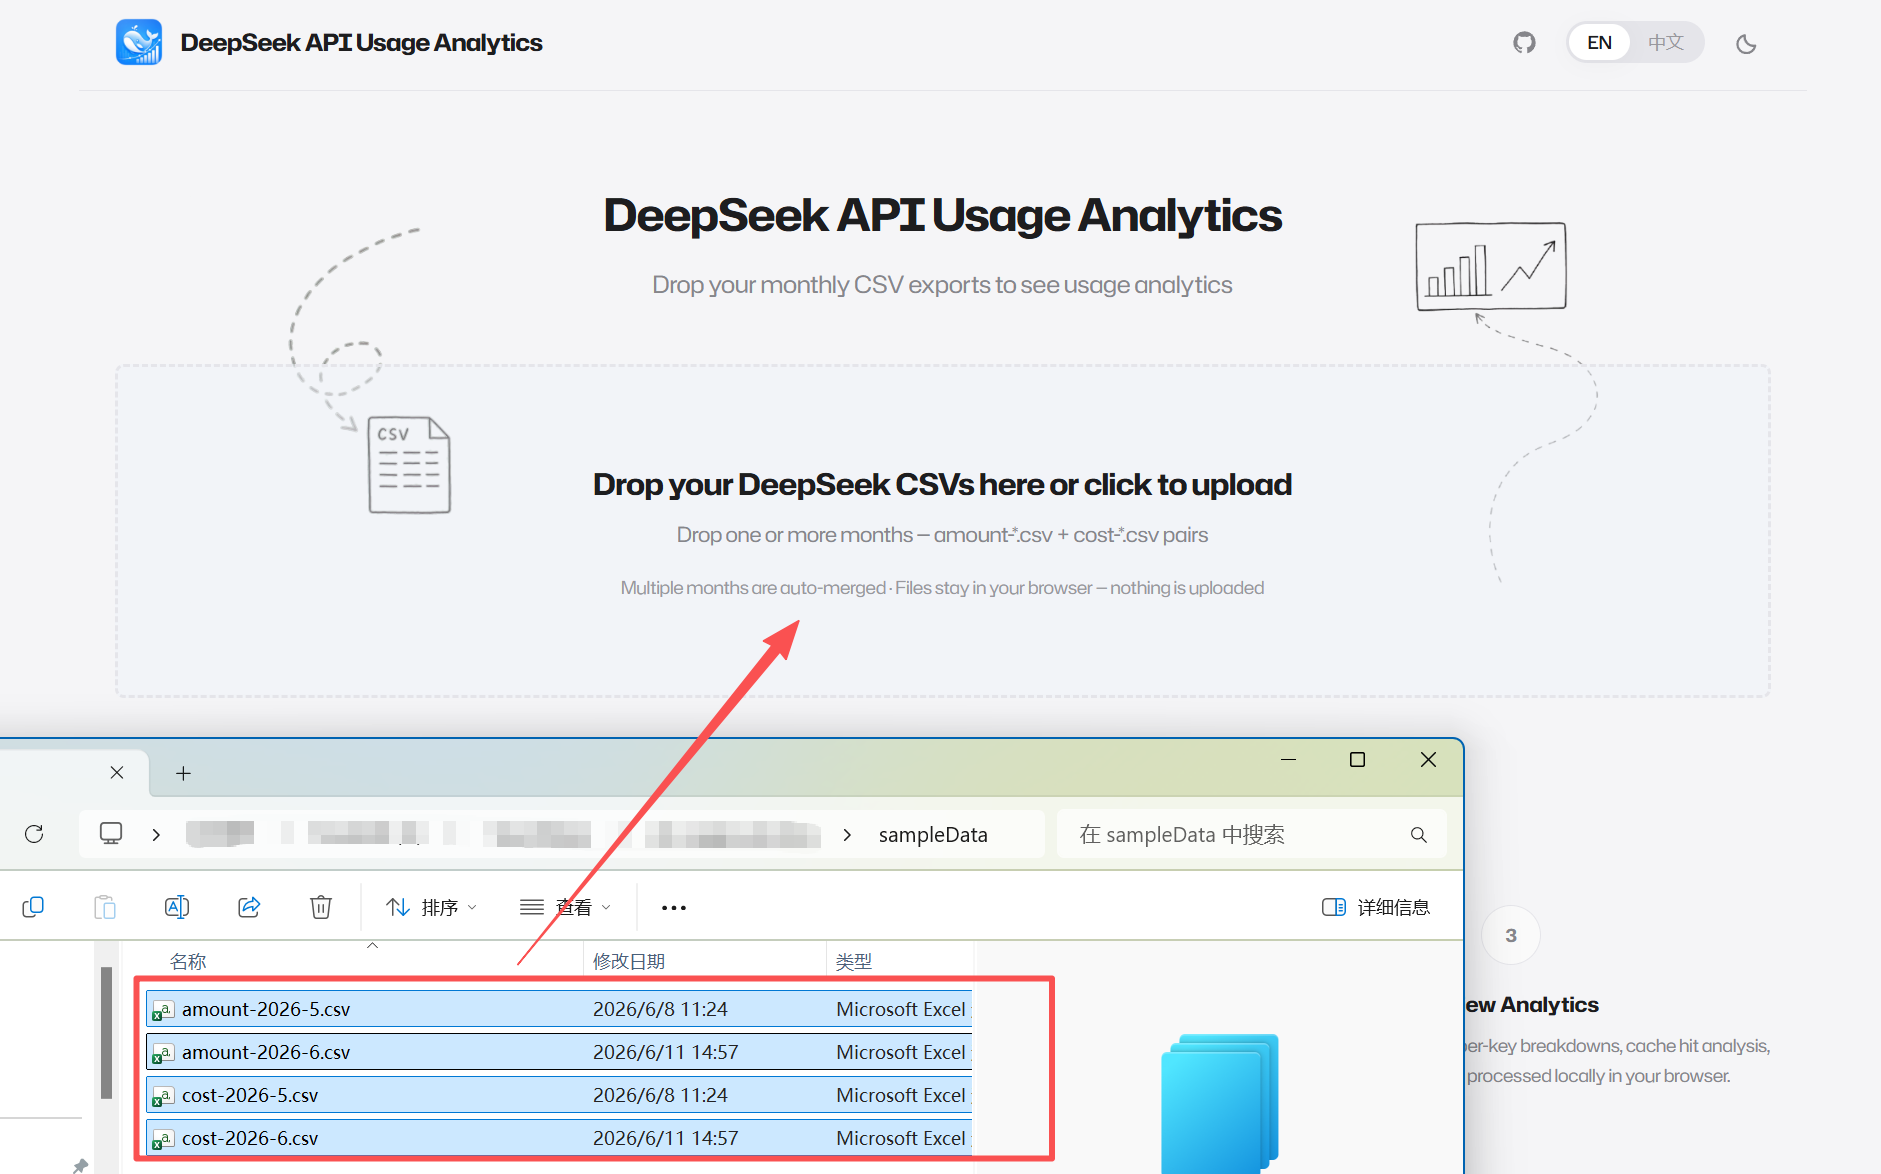
How to Use
Three steps, 30 seconds:
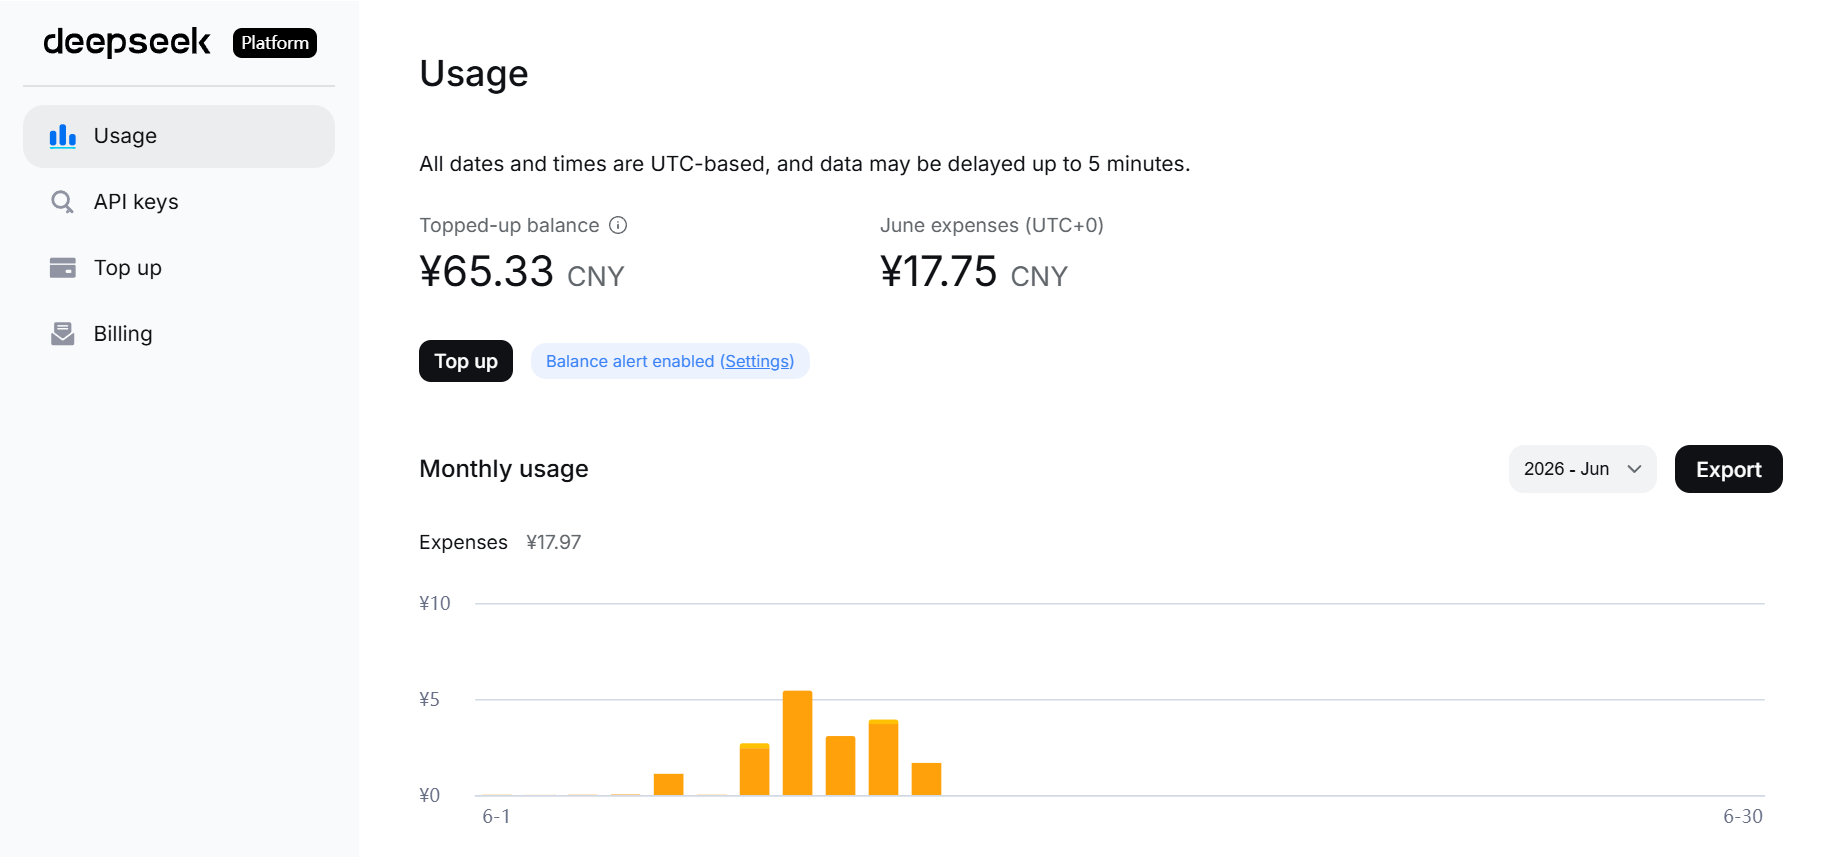
- Log in to the DeepSeek Platform, go to the Usage page, select a month and export CSV files (you'll get
amount-*.csvandcost-*.csv) - Open https://deepseek-usage.xyz
- Drag and drop your CSV files — done
No registration, no installation required.
About MindRose
We're MindRose, a tech team focused on delivering lightweight digital solutions for small and mid-sized manufacturers, logistics companies, and cross-border traders.
We don't sell vague "digital transformation" — we use AI and full-stack agile development (Next.js, React, Mendix, and more) to deliver applications that solve real business pain points within weeks.
This dashboard is a free open-source tool, but the technical capability and product thinking behind it is the same as what we bring to commercial projects: first understand the problem, then solve it with the right technology, and polish the experience to perfection.
If you're considering:
- Building a custom data dashboard or BI tool for your enterprise
- Deeply integrating AI into your business workflows
- Building a modern, elegant internal management system
- Further collaboration based on this open-source project
Feel free to reach out via our Contact page. We offer free bottleneck diagnosis and tailored solution advice.
Try it now: https://deepseek-usage.xyz
GitHub Repo: https://github.com/GavinCnod/deepseek-api-usage-analysis
Stars ⭐ and contributions welcome!